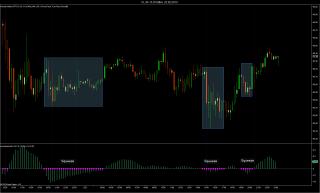
This is a simple Bollinger Band Squeeze. The Bollinger Band Squeeze compares directional volatility as measured by the standard deviation to non-directional volatility as measured by the average range.
The squeeze is a situation, where Bollinger Bands are inside a Keltner Channel. This indicator does not plot the Bollinger Bands and the Keltner Channels, but plots the distance of the Bollinger Band from the Keltner Channel and displays it as a histogram.
When the histogram has a positive value: This means that the Bollinger Bands are outside the Keltner Channel. Directional volatility is high or normal.
When the histogram has a negative value: This shows low directional volatility, which is called "the squeeze". For better visibility, the squeeze is reinforced with dots. When activated, sound alerts will inform you that the squeeze is on.
A squeeze is a good opportunity to enter a position, as it reflects a temporary period of balancing or indecision. To determine the direction of the expected breakout from the squeeze, other indicators should be used. In his book "Mastering the Trade", John F. Carter suggests a momentum indicator do determine the direction of the trade, but I do not think that this is sufficient to create a profitable system. You will need further indicators.
If you enter a trade during a squeeze, this usually leads to a good reward-to-risk ratio, as you will typically be able to use narrower stops during low volatility periods.
Category NinjaTrader 7 Indicators
|
|
|


