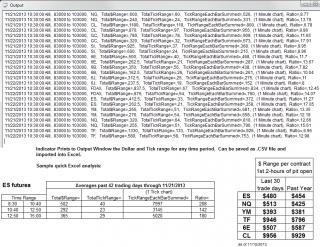
This indicator allows a pretty quickly analysis of any chart data to determine the $Dollar and Tick range each day during any intraday time period for whatever symbol you have charted.
It prints data to the Output Window in Ninja so be sure you have that open. You can save that data as a .csv file and then open in Excel if you want to analyze further. I purposely put commas between the labels and the data just so I could import to Excel. If you use a super fast chart (like a 1-tick) it will make your CPU crawl so be careful not to have too many days of data on your chart. For a 1-tick chart, less than 15 days isn't bad. For minute data, years is very quick.
"TickRangeEachBarSummed" for a 1-tick chart represents the total "travel" of every wiggle in price. This is of course dependent on your data provider and may vary depending on if they filter the data you are charting. "TickRangeEachBarSummed" for any other chart type is the addition of every bar's High minus its Low.
Category NinjaTrader 7 Indicators
|
|
|


