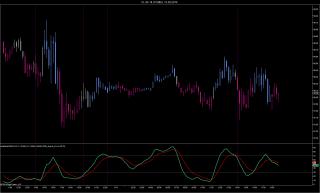
The indicator shows the Double Smoothed Momentum - see Stocks & Commodities, May 1991.
Blau Double Smoothed Momentum (DSM-B): The raw Stochastics is calculated as the percentage value for the close within the range created from the highest close and the lowest close over the lookback period. The term "Double Smoothed Momentum" is somewhat misleading. The DSM-B is obtained by separately double-smoothing both numerator and denominator of the raw Stochastics. The double-smoothed value for the numerator is then divided by the double-smoothed value for the denominator.
Stochastics Smoothing: William Blau twice applied an EMA to both numerator and denominator of the raw Stochastics. This indicator allows to use 30 different moving averages for the smoothing. The same moving average type is used for the first and the second average calculation.
Parameters: The lookback period for the raw Stochastics indicates the number of bars for which the highest close and lowest close is determined. The lookback period is comparable to all other Stochastics indicators. The default value is 14 bars. The double smoothing of numerator and denominator is done with two moving averages. The first smoothing is typically done with a faster moving average, the second with a slower moving average.
Signal line: William Blau did not use a signal line for the double smoothed indicators. I have added the signal line, because the cross of the signal line can be used as a trend indication. Moving average type and period for the signal line can be selected.
Histogram: The indicator has an option to plot a histogram, which shows the difference between DSM and signal line.
Trend definition: The indicator exposes the current trend via an IntSeries. The trend can be determined based on the DSM (rising & not oversold, falling & not overbought, neutral), the signal line (rising & not oversold, falling & not overbought, neutral)) or the DSM / signal line crosses. All trend definitions are not straightforward, but require a higher close to switch to an uptrend, or a lower close to switch to a downtrend. Moreover the DSM / signal line cross will only show an uptrend, when not oversold and a downtrend when not overbought.
Paint bars: The paintbars can be used to plot the trend information. The trend states are uptrend, downtrend and neutral trend as explained above. It is possible to apply the indicator to the price panel and unselect the indicator plots. This allows to use the indicator as a "paintbar only" indicator.
Sound alerts: The indicator comes with sound alerts which are triggered when the trend changes. The sound files are included with the zip file and should be manually copied into the directory Documents -> program files (x86) -> NinajTrader 7 -> sounds.
Category NinjaTrader 7 Indicators
|
|
|


