Exported with NT Version 8.0.17.2
Indicator Name: fpgBuySellNetVolume_V2 Folder: Cheech
This version functionally replaces the previous version(s) described and available here but does not replace it when this version is installed. The previous version can be removed manually when and if desired.
Enhancements/Changes in Version 2
1. User can select from several MA types for the Moving Average plots, some of which are from Lizard Indicators made available by the GNU license. Credits to Lizard Indicators for both their indicators and the MA selection code.
2. When MA smoothing is selected the type can be an SMA, EMA, or the selected MA type. The smoothing period for each MA (fast, mid, and slow) can be set individually. A MA period of 0 eliminates the smoothing for that MA. Note: The Mid MA can be used as an intermediate period by specifying a value between the fast and slow periods. When the mid MA is requested with zero value for the period (default) will result in the mid period being calculated. If a period is specified and it is not between the fast and the slow the midpoint is calculated and used. No warning message is displayed.
3. The ability to apply volume filters (1-4) against the Net volume thereby limiting the Net volume histogram display a net bar only for the volume specified in the filter(s).
4. More control over how plots are displayed.
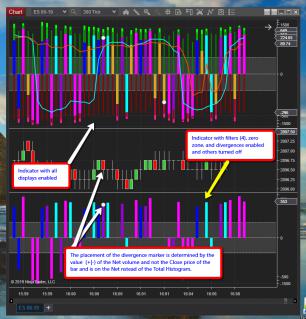
5. The divergence marker has been moved from the Total histogram to the Net histogram. This was done because the Total histogram can be turned off. The Net and/or Net filters must be active for the divergence marker to be displayed. If the Filter option is chosen without the Net plots being display the marker will only be display when there is a divergence on a filter value.|
6. The plot for the in-progress bar has its own color and can be user set. This plot is always displayed regardless of the display option selected.
7. This is not a change but a clarification as it also existed in the previous version. The position of the total line (above the line if a buy total and below the line if a sell total) is not based upon the last Close price but on the value (positive or negative) of the Net volume.
Similar to the previous version at times setting the Indicators region Type property to Logarithm is easier to read. The 2 instances of the indicator in the screen shot have the same operation modes set but the bottom one shows some of the ability to control what is displayed. without needing to independently setting each to transparent. If a particular display is turned off the values are still calculated and can be viewed in the Data Box.
Change Log
Date Description
April 12, 2019........Initial release
Category NinjaTrader 8 Indicators and More
|
|
|


