Combine Indicators to Identify High-Probability Reversals
MARCH 11, 2013 5:00 AM1 COMMENTVIEWS: 829
I read about this indicator in an article titled “The DMI Stochastic,” which appeared in the January 2013 issue of Technical Analysis of Stocks and Commodities. The article was written by Barbara Star. In the article, Star combined two well-known technical indicators to create an innovative new tool that can be used to identify high-probability reversal candidates.
The following article explains the procedure required to calculate the DMI stochastic (DMISTO) and demonstrates the potential of this new indicator with a sample
pullback strategy that achieved a
win rate of over 80% (since 2000 – in sample). AMIBroker code for the DMIS is included at the end of the article.
The DMI Stochastic (DMISTO)
In the late 1970s, J. Welles Wilder introduced the Directional Movement Index (DMI), which is made up of two components: the plus directional movement indicator (+DI) and the minus directional movement indicator (-DI). Star subtracts the -DI from the +DI to create an oscillator that reflects both the strength and direction of the recent price trend. Positive values indicate rising prices and negative values signify falling prices.
Star then used the resulting DI oscillator as an input into the standard Stochastic indicator, which normally uses the closing prices of the underlying security. The Stochastic indicator calculates three different values: fast %K, slow %K, and %D. Fast %K is based on the relationship of the current value of the input variable (the DI oscillator in this case) relative to the lowest and highest values of the input variable over a user-specified look-back period. The slow %K is simply a
moving average of the fast %K. %D is a moving average of slow %K.
A Sample DMISTO Reversal Strategy
I used AMIBroker to build a simple test strategy to better understand how DMISTO works and how it could be used to add value. DMISTO is an oscillator, so I created a weekly reversal strategy to buy when conditions were oversold and sell when the market was overbought.
To ensure the DMISTO strategy always traded in the same direction as the long-term trend, I used a moving average filter to eliminate long trades when the closing price was below the long-term moving average and prevent short trades when the closing price was above the moving average.
I optimized the strategy based on weekly values of the S&P 500 Index, the Russell 2000 index, and the
NASDAQ 100 index from January 2000 to January 2013. Only one trade was permitted at a time and each trade represented 100% of portfolio equity. No stops were used. The purpose of this exercise was a proof-of-concept only. As a result, I did not withhold an out-of-sample data set. While the example below was based on weekly periods, the DMISTO could be used for daily periods as well.
Optimized Parameters:
User Specified DMI and Stochastic Look-back Periods: 10 weeks
Stochastic Moving Average Periods for Slow %K and %D: 3 weeks
Long Entry: (Weekly Slow %K Crosses Above %D) AND (%D < 9)
Short Entry: (Weekly Slow %K Crosses Below %D) AND (%D > 85)
Moving Average Filter Period: 27 weeks
Long Exit: After 7 weeks
Short Exit: After 5 weeks
The top panel in Figure 1 below is a weekly candlestick chart of the NASDAQ 100 index (NDX) for approximately the last 12 months. The blue line signifies the 27-week moving average that was used to filter long and short trades.
The middle chart pane illustrates the DMI Stochastic values for slow %K (blue) and %D (purple). The
bullish and
bearish signal thresholds from the optimized strategy are represented by the green and red horizontal lines, respectively.
The bright green arrows represent prospective buy signals that met all of the strategy criteria. Note: not all of these trades would have been executed. Remember, only one position was permitted at a time and the strategy was tested on three different indices. In addition, trades remained open for multiple weeks. Nevertheless, the prospective signals should help you understand the types of trades executed by the DMISTO reversal strategy.
The DMISTO reversal strategy does not trade frequently, but it does attempt to identify very high probability trades – always entering after pullbacks, but still trading in the same direction as the prevailing trend.
Figure 1: DMISTO - Weekly S&P 500 Index
Figure 1: DMISTO – Weekly S&P 500 Index
The third panel depicts the DI oscillator (the difference between DI+ and DI-), which was used as an input to the Stochastic (10,3,3). It is interesting that the two long trades above were both executed when the DI oscillator was negative (DI- larger than DI+), but the DI oscillator was increasing.
DMISTO Strategy Results
The optimized DMISTO strategy earned a compound annual return of 10.01%, but was only invested 24.08% of the time. The resulting risk-adjusted annual return was 41.58%. The maximum peak to trough
drawdown was 11.92%, which resulted in an attractive
CAR/Maximum Drawdown ratio of 0.84.
A remarkable 81.48% of the trades were profitable and the average profit on winning trades was 6.84% versus an average loss of -3.60% on the losing trades. The corresponding profit factor was 6.62; total gains were 6.62 times total losses. The Sharpe ratio was 1.79. The comprehensive strategy statistics are provided in Figure 2 below.
Figure 2: DMISTO Sample Strategy Results
Figure 2: DMISTO Sample Strategy Results
The equity curve for the sample DMISTO strategy is provided in Figures 3 below.
Figure 3: DMISTO Strategy - Equity Curve
Figure 3: DMISTO Strategy – Equity Curve
The equity drawdown curve is provided in Figure 4 below. The maximum drawdown was 11.92%, but
drawdowns have remained below 10% since 2004.
Figure 4: DMISTO Strategy - Equity Drawdown
Figure 4: DMISTO Strategy – Equity Drawdown
DMISTO AMIBroker Code
Below is the AMIBroker code for the DMISTO. It is a
screenshot from my AMIBroker platform, so you would need to retype the code into your AMIBroker platform if you would like to experiment with the DMISTO. The DMISTO code compiles and runs without error on my platform, so if you encounter any errors, they are probably the result of typos.
Note, the c
ode below is for the DMISTO, not for the DMISTO strategy – although the sample parameters in the code below are the optimized parameters for the strategy.
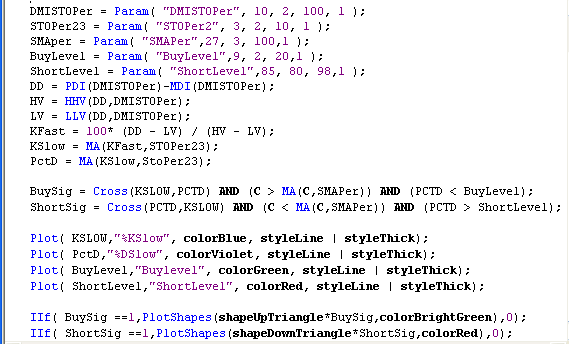
Figure 5: DMISTO AmiBroker Code (Revised)
Figure 5: DMISTO AmiBroker Code (Revised)
As always, the DMISTO code and sample strategy are presented for educational purposes only and are not intended as investment advice. I do not consider the DMISTO sample strategy above to be viable in its current form due to the lack of stops, which precludes any means of position sizing or risk management.
Conclusion
Buying pullbacks in the same direction as the long-term trend is a popular approach for systematic traders. These types of strategies typically identify high probability trades and tend to perform well. The DMISTO indicator shows promise for use in these types of systematic trading strategies. While optimized, the strategy results were impressive, especially for only using a single indicator and a simple moving average filter.
Ideally strategies should incorporate several different types of indicators for trade confirmation. In addition, a longer time period (including out of sample data) should also be used when developing strategies. While the above strategy needs additional work, the DMISTO indicator shows promise.
– By Brian Johnson from Trader Edge


