Welcome to NexusFi: the best trading community on the planet, with over 150,000 members Sign Up Now for Free
Genuine reviews from real traders, not fake reviews from stealth vendors
Quality education from leading professional traders
We are a friendly, helpful, and positive community
We do not tolerate rude behavior, trolling, or vendors advertising in posts
We are here to help, just let us know what you need
You'll need to register in order to view the content of the threads and start contributing to our community. It's free for basic access, or support us by becoming an Elite Member -- see if you qualify for a discount below.
-- Big Mike, Site Administrator
(If you already have an account, login at the top of the page)
FWIW, my feelings on the last few posts (is it time to short the ES) can be best summarized by "who knows". Put another way, my feelings are that chart patterns are fun to look at -- but every tick in the market is unique. The saying 'history repeats itself' is quite true in some ways, but not all, especially within the market. Each tick, each time, each trend line, each Elliott Wave, each retracement -- they are all unique. So don't place too much emphasis on what the pattern says to do.
Instead, just focus on what is in front of you. You need to frame the market based on your own methods. Then take action based on your findings, if action is called for. If you are wrong, then get out. If you are right, then good job. Focus on money management -- expectancy etc, and you'll do fine. Simple as that, right?
Agreed. The market is fractal, except when it isn't.
I think, though, with some geometry you can place trades with high expectancies and favorable risk/reward ratios so you don't have to be right most of the time. You don't have to know where the market is going, only make an educated guess, wrapped around good risk management. Tie it in with out of the money stock/ETF options based on time and price projections and you can reduce your risk/reward even lower.
FatTails,
nice work with your confluence indicator and your analysis on the probabilities at certain levels. May I ask if you include other levels not strictly related to fibonacci in your indicator. Reason I ask is while doing some statistical research myself I happen to notice levels like 1/4, 1/3 1/2 (that one all fib people usually include though) 2/3 and 3/4.
Theoretically one could of course get probabilities for all levels on all zigzag variants and then find confluence. But I actually run an old computer as I mainly trade watching price action without any indicator at all and suspect it to be way too slow.
I completely agree. As soon as we start thinking we know what is going to happen we better watch out. Even if you are correct in your assessment why not let the market show you first and then look to take a trade.
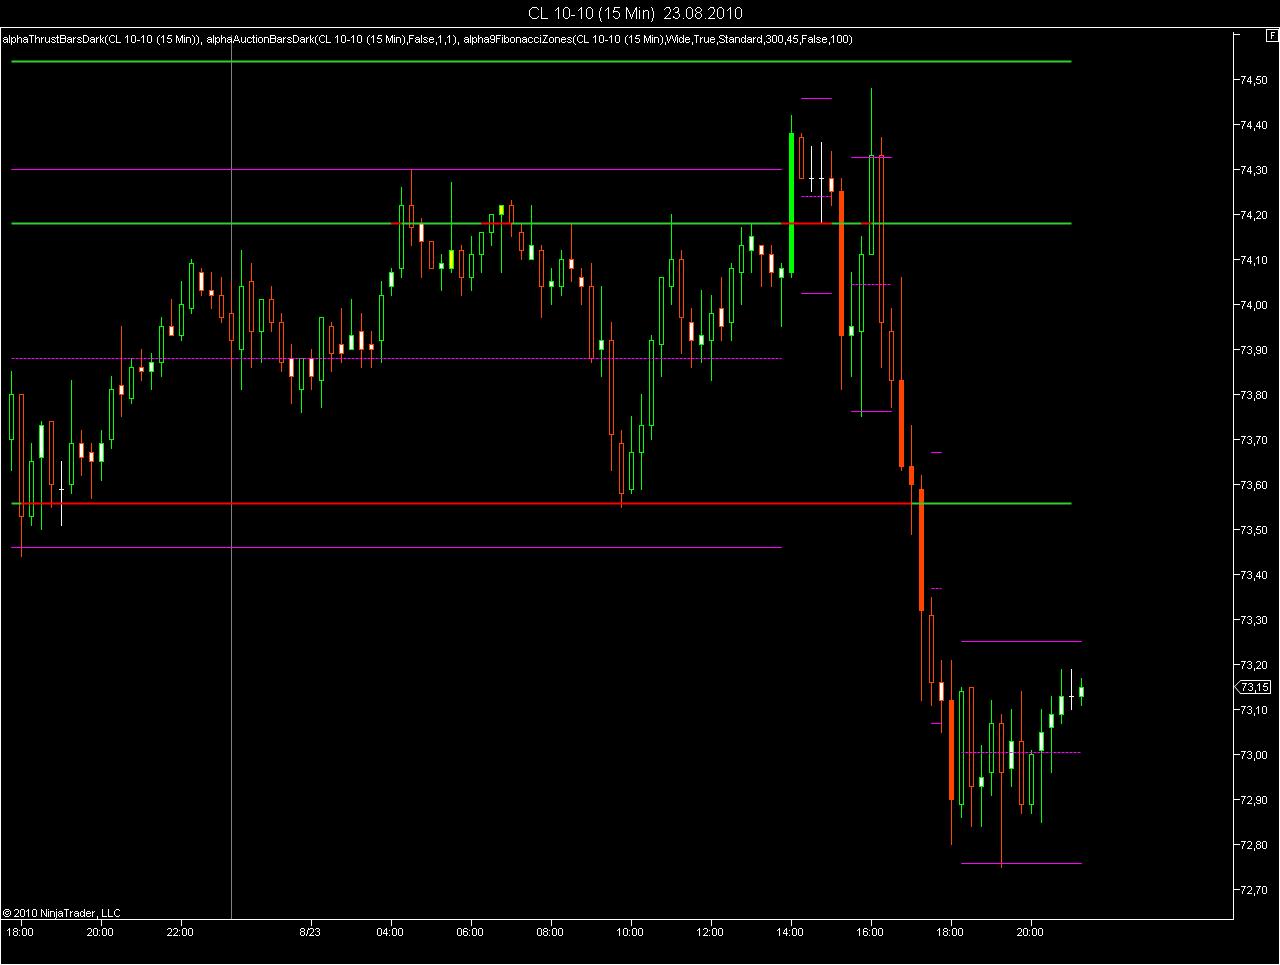
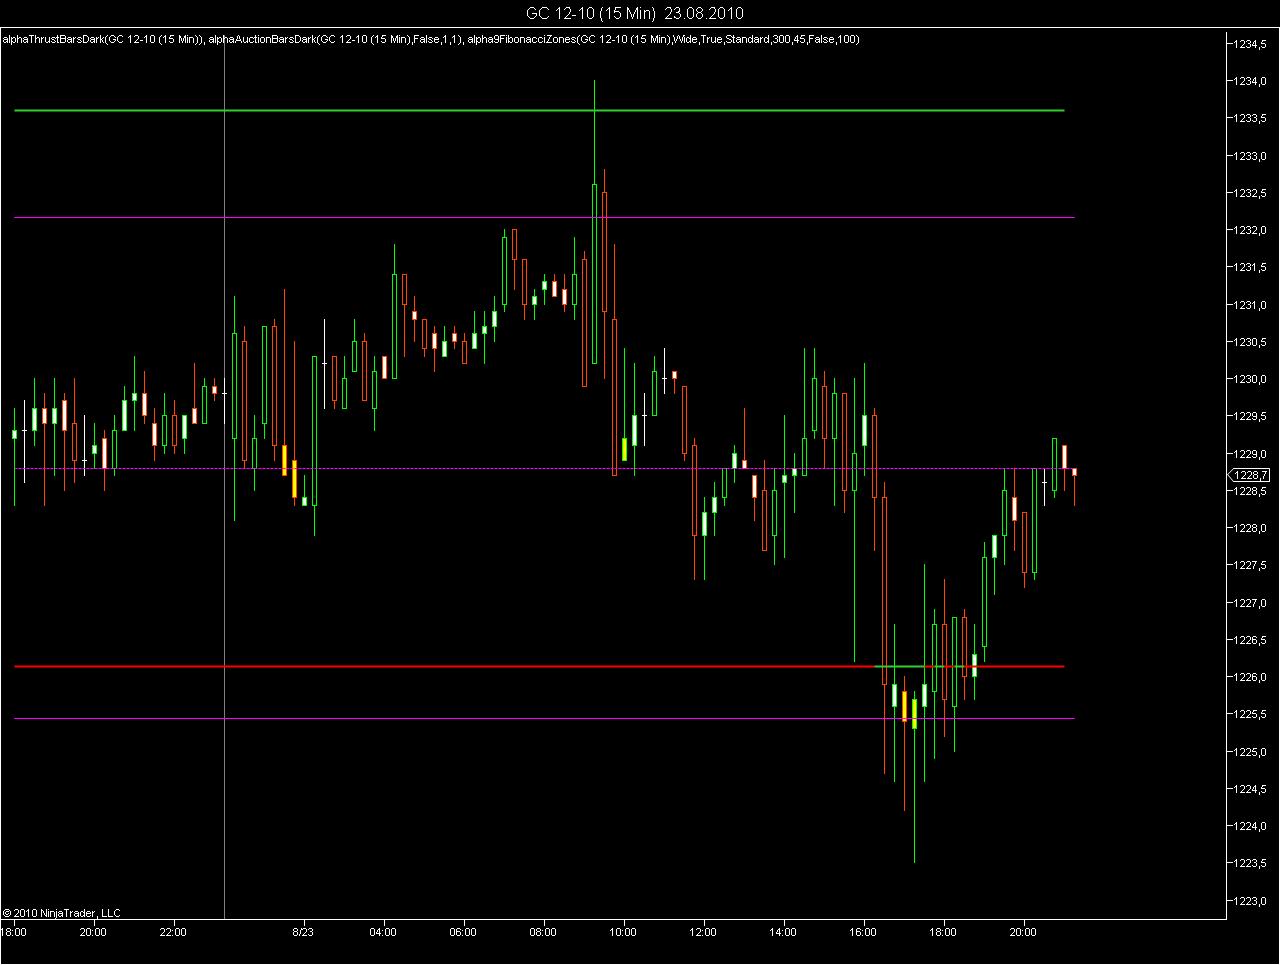
By the way, I don't want to post off topic, but I was wondering if confluence of fibs combined with other methods have value? For example, this attached chart with a 78.6 retracement with MP zone. I apologize if the post should be in its own thread.
If you wait for the market to show you first, you will enter to late. I feel that I am only rewarded, if I take a risk, which is always a difficult decision. I look at risk-to-reward and not at no-risk-to-no-reward ratios.
You need to combine fibs with other methods. A fib line has a probability that price will react, there is no certainty. The probability will increase, if you find other valid arguments to enter or exit a trade. One fib line is not a sufficient reason in any case. Also I would like to see some confirmation by volume and price action.
What I mean by the market showing you first would be to see if the areas that one has indicated as support or resistance is indeed acting as such. If the support or resistance level is defined from a much higher time frame such as a daily chart or a 60 minute chart and we see the area holding on a smaller time frame wouldn't that provide some degree of comfort that maybe the area is holding?
Yes, I usually do not enter a trade because somewhere my chart shows a line. I watch price action, when it approaches the fib line. I would enter on the way back from a retest of the high or low.
I do look at different timeframes. Ideally I want to see a retest of price within the smaller timeframe, which is a retest in a larger timeframe as well. Quite agree with you!
All ranges and lines plotted in real time without redrawing. There are support and resistance levels, which cannot be explained by Fibonacci lines, as not all traders use them. Pivots for example would be as important. But on each of the Fibonacci lines, a sufficient number of traders is gathering to make them tradeable on range days.