Welcome to NexusFi: the best trading community on the planet, with over 150,000 members Sign Up Now for Free
Genuine reviews from real traders, not fake reviews from stealth vendors
Quality education from leading professional traders
We are a friendly, helpful, and positive community
We do not tolerate rude behavior, trolling, or vendors advertising in posts
We are here to help, just let us know what you need
You'll need to register in order to view the content of the threads and start contributing to our community. It's free for basic access, or support us by becoming an Elite Member -- see if you qualify for a discount below.
-- Big Mike, Site Administrator
(If you already have an account, login at the top of the page)
Of course, we would all like to be able, to buy the low and sell the high of every move, but that is a reality that can only be realized when practiced in hindsight. In real-time, there are very few traders that can pull this feat off with any real kind of consistency. To catch the beginning of a trend implies that we must either anticipate price exhaustion and the subsequent reversal of the previous trend, or anticipate and catch the breakout from a trading range. What makes this task so complicated and frustrating is that there are so many false reversals and false breakouts.
Unfortunately though, markets are in a trading range 80% of the time, which means that markets are trending only 20% of the time or approximately 4 days a month. Markets like the ES and ZB which are heavily arbed and dominated by HFTs and algorithmic trading, are often lacking volatility, and are choppy and directionless. This has proven to be a major challenge for short term traders, who often find themselves faked out on seeming moves that reverse. It would make sense then, that following a momentum based strategy as the mainstay of your methodology would not be optimal. It would seem that not only including, but concentrating on a strategy that offered you the opportunity to capitalize on current market conditions would be economically prudent.
The general idea is to find points in the market in which bulls or bears are trapped. They have committed to positions, but can no longer move the market their way, and the market has become over-extended. They then have to exit out of their positions and the market reverses which provides a trading opportunity. Traders often presume that breakouts will continue in their direction without actively planning for the possibility of retracement, so why not take advantage of this reality and actively build a scenario for a possible reversion trade.
As a rule traders are drawn to movement and momentum. They like to trade breakouts from ranges, and they like to see clear signs of strength or weakness before they buy or sell. A lot of the passive algorithms are programmed to take advantage of these tendencies by selling the new highs and buying the new lows. Now consider that there are thousands of these programs on thousands of computers, and each one is programmed to work offers at X period highs and work bids at X period lows--and if you imagine X as scalable across all time frames, then you can get a sense for what drives markets over the short time frame when directional, institutional traders are not active. Small wonder why the markets rarely trend, and are often range bound instead!
The predominant benchmark for AT is the VWAP or volume weighted average price. The VWAP is simply the average price of a security traded over a period of time. It is essentially a tool for investors that want to be passive in their execution, and are seeking the average price based on volume, i.e., a guaranteed VWAP execution. The implementation of the VWAP was in response to the decimalization of the market and the proliferation of algorithmic trading that resulted from this change, and became popular as a way to reduce transaction costs and the impact of large institutional orders on the market.
Knowing where we are trading during the day relative to that day's VWAP is very helpful in identifying the kind of day that we're in. The VWAP can be thought of as the market's evolving estimate of value. In a weak trending or non-trending market, we will tend to move away from VWAP to probe trader/investor interest. If that interest is lacking, we will tend to gravitate back toward that VWAP value level. In weak trending markets, you want to be fading moves away from VWAP. In a good range trade, we'll tend to see a narrow value area (volume will be transacted within a narrow price band) and moves away from value will tend to return back to (and usually through) VWAP. In a true range trade, we'll also see little slope to VWAP, as we transact volume relatively evenly above and below that average price. We can take advantage of this tendency for the market to move 1, 2, or 3 standard deviations away from the VWAP and then revert back to the mean, by fading the moves away from the VWAP and covering the trades when they return back to the VWAP.
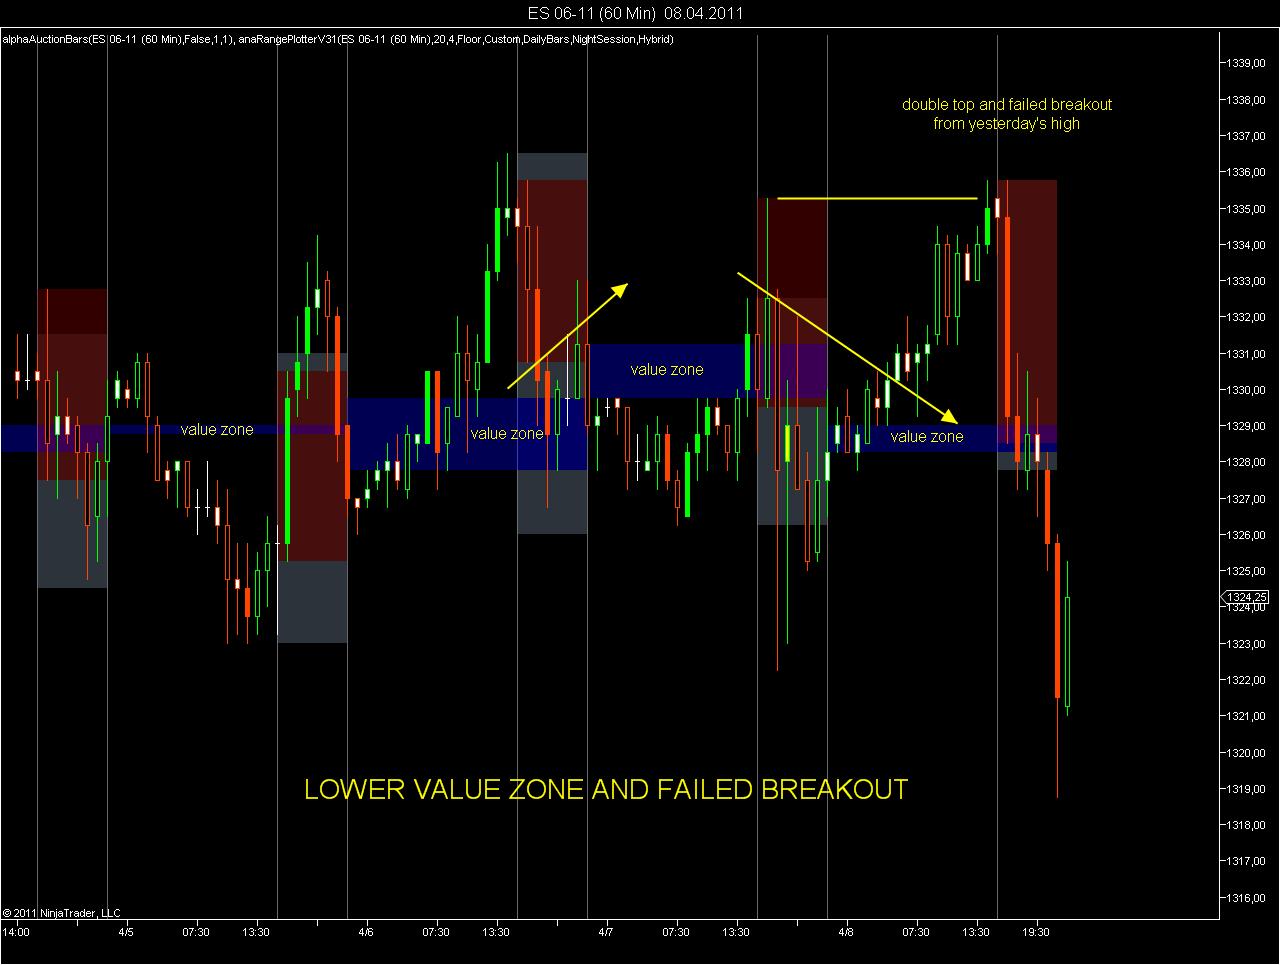
This is a key statement. Trading is about anticipating what others are doing. If they get trapped you can exploit this. Markets are mostly in a state of bipolar disorder, where they do not know which way to turn. This is a characteristic by design, as there is an eternal, though instable balance between buyers and sellers. So most of the time markets do test the borders of the previously established value zones, as they look for confirmation of their validity.
A breakout out can only occur when some pressure has been built up, that is when smaller time frame traders can no longer outweigh the drift of the positions of the larger time frame traders. The latter are needed to make up for a successful breakout. The smaller timeframe traders cannot sustain the breakout, as they will close their previously entered positions and drive price back into the range.
Markets rarely trend because the playing field is delimited by fundamentals. At some stage, the feedback play of technical traders is interrupted by fundamental traders who step in to grasp the opportunity.
VWAP is indeed one of the main attractors for an intraday reversal trades. When entering a reversal, I ask several questions:
-> Entry Price: Where are the borders of the current value zone?
-> Entry Timing: Will the test of the borders lead to a breakout or a rejection? Typically the first test results in a rejection.
-> Rejection of one of two scenarios: At what time one of the scenarios - breakout or reversal - can be rejected. Best indicator here: one of the parties has been trapped.
-> Target Price: Fibonacci retracements from 38.2% to 78,6%, high or low of the opening range, yesterday's high or low, pivot range, VWAP.
VWAP stands for today's value, the pivot PP for yesterday's value (the POC of market profile can be used as well).
FT has been a huge help to me since hes been here and a big thanks to him and Tiger as well . Heres a great webinar he did a little while back , the most thorough fib lesson Ive ever seen . Ditto on the mean reversion suggestion .
Mike has kindly asked me to do a webinar on Fibonacci Trading. As I could not refuse the request, I simply agreed. The webinar will take place on July 25, 3:00 PM Eastern Time.
It is my first webinar ever, so I am sure it will be some fun.
Given the quality of the original post (thanks tigertrader), I'm a bit surprised how relatively little response there is from the forum... It seems that people are still chasing the next great indicator that makes their charts pretty ("all you have to do is buy when this color turns blue, and sell when it turns red. Easy."). Then, three days later, after a couple of losses, the new magic indicator is abandoned in favor of the next thing that makes their charts even prettier.... and so on.... instead of actually learning anything about how to trade, which is nothing other than understanding price action (yes, I am biased and it works for me).
I call these Puke Points. Identifying these is not a matter of changing indicator colors, but rather grasping market contextuality (aka wtf is going on at the moment).
This morning's NQ trade might be a good example (attached). The overnight market bounced off the Pivot Point and headed towards R1 at the open. Didn't reach it and then reversed..... Is this a good reversal to take??
The question is, what is the puke point? Specifically, at what price are longs likely to give up? Analyzing the 5 min. and 15 min., I felt that it would be about 2336. The entry worked out great, and to make it short, the first contract got closed at +3, and then the runner at the PP for +7.25.
No, this is not the Holy Grail. There are times when this fails... just like anything. But what tigertrader mentions can be a solid long-term profitable trading framework.
Just reading PA and thinking about puke.
You are never in the wrong place... but sometimes you are in the right place looking at things in the wrong way.
When looking at yesterdays 6E chart, were there any hints for such a trend day? I was looking for shorts nearly the whole day. First time around 9:50 CET because 6E had already exceeded its average daily range. Then again after US open at 16:05 and 17:27 CET when it hit R3. But the euro was unstoppable. It didn�t touch the vwap the whole day.
Where did you guys see possible long entries to ride the trend?