NexusFi: Find Your Edge


Home Menu


Coding Multi Time Frame (MTF) Indicators with NinjaTrader


Discussion in NinjaTrader

Updated
      Top Posters
    1. looks_one Fat Tails with 180 posts (562 thanks)
    2. looks_two Zondor with 19 posts (29 thanks)
    3. looks_3 madLyfe with 16 posts (10 thanks)
    4. looks_4 BankRobberNT with 14 posts (16 thanks)
      Best Posters
    1. looks_one gomi with 3.7 thanks per post
    2. looks_two Fat Tails with 3.1 thanks per post
    3. looks_3 Zondor with 1.5 thanks per post
    4. looks_4 BankRobberNT with 1.1 thanks per post
    1. trending_up 189,653 views
    2. thumb_up 743 thanks given
    3. group 87 followers
    1. forum 424 posts
    2. attach_file 166 attachments


Search this Thread

Coding Multi Time Frame (MTF) Indicators with NinjaTrader

  #31 (permalink)
 
NinjaTrader's Avatar
 NinjaTrader  NinjaTrader is an official Site Sponsor
Site Sponsor

Web: NinjaTrader
AMA: Ask Me Anything
Webinars: NinjaTrader Webinars
Elite offer: Click here
 
Posts: 1,714 since May 2010
Thanks Given: 203
Thanks Received: 2,686

Zondor,

We are not aware of any limitation regarding plots updating only on BarsInProgress == 0. Please try the attached test reference on a 1min chart. The indicator adds two additional 30 second series which would process twice as much as the BIP0 of 1min. The indicator has 3 plots, each one representing the number of bars of each Bar series multiplied by a different factor so we can view them easily. With the Output Window open you can see the last BIP0 event shows CurrentBar counters of 4805, 22764, and 33738 for BIP0, BIP1, and BIP2 respectively. The next event was the BIP1 event which updated the BIP1 counter to 22766 and the final BIP2 event updated the BIP2 counter to 33741. There has been no subsequent BIP0 event yet so if it were the case that plots only updated on BIP0 then we would actually still be seeing the original values of 4805, 22764, and 33738, but instead we are seeing the BIP1 and BIP2 updated values on the chart of 4805, 22766, and 33738.

In our test the chart is “refreshing” and updating whenever deemed necessary by the code as it asks to update the plot values. I would be curious how your environment might differ from ours and/or how your code might be different? It would be great if you could breakdown how exactly you came to the conclusion that these values do not update on the chart outside of BIP0.

Thank you.

Attached Thumbnails
Click image for larger version

Name:	1.png
Views:	381
Size:	60.8 KB
ID:	39310  
Attached Files
Elite Membership required to download: BIPTests.zip
Follow me on Twitter Reply With Quote

Can you help answer these questions
from other members on NexusFi?
NT7 Indicator Script Troubleshooting - Camarilla Pivots
NinjaTrader
Cheap historycal L1 data for stocks
Stocks and ETFs
REcommedations for programming help
Sierra Chart
MC PL editor upgrade
MultiCharts
Trade idea based off three indicators.
Traders Hideout
 
  #32 (permalink)
 
Zondor's Avatar
 Zondor 
Portland Oregon, United States
 
Experience: Beginner
Platform: NinjatraderŽ
Broker: CQG, Kinetick
Trading: Gameplay KlownbineŽ Trading of Globex
Posts: 1,333 since Jul 2009
Thanks Given: 1,246
Thanks Received: 2,731


Quoting 
We are not aware of any limitation regarding plots updating only on BarsInProgress == 0.

Thanks for responding, Ninjatrader. Glad to see your interest in this important and under appreciated topic.

Right now, in real time, I am running an indicator that plots an ADDed series of ^TICK on a chart having primary series YM. To test it I run it side by side with a Time and Sales of ^TICK.

If the line (#303)
 
Code
 if(!Historical  && BarsInProgress==1 && displayprice!=mrp && forcerefresh && lastBar>0 )ChartControl.Refresh();
,
is in the code, the plot of ^TICK updates in lockstep to the T &S. As soon as I comment out the line and refesh the chart, the plot of ^TICK only updates when there is a trade of the YM, which sometimes doesn't happen for a while.

It's ideal to test this on the chart of a master instrument that trades much slower than the ADDed secondary instrument. Then it is very noticeable when the chart does nothing in response to ticks of the secondary instrument that print to the Time and Sales.

I mentioned this on the Ninjatrader forums using my secret identiy of "Ricam". RyanM responded with a request for clarification.

In your code, all the events happen as they should. So the print statements all fire. Mine did that too. But the plots would not update on the screen image unless it was a BIP=0 update. It's only the visual appearance of the chart on the screen that lags. As far as I know the code in the OnBarUpdate method always DOES respond correctly to the events generated for each of the Bars series.

My indicator is attached fo you to play with. I would call this version a "pre-beta". You will see that I have been doing a lot of error tracking. It runs without any runtime errors most of the time now. It seems to be accurate for real time data, but maybe not for backfilled data... but that's a whole other story.

Attached Files
Elite Membership required to download: SecondaryIndicatorLinePlot3.cs
Follow me on Twitter Visit my NexusFi Trade Journal Reply With Quote
Thanked by:
  #33 (permalink)
 
Fat Tails's Avatar
 Fat Tails 
Berlin, Europe
Market Wizard
 
Experience: Advanced
Platform: NinjaTrader, MultiCharts
Broker: Interactive Brokers
Trading: Keyboard
Posts: 9,888 since Mar 2010
Thanks Given: 4,242
Thanks Received: 27,103


NinjaTrader View Post
Zondor,

We are not aware of any limitation regarding plots updating only on BarsInProgress == 0. Please try the attached test reference on a 1min chart. The indicator adds two additional 30 second series which would process twice as much as the BIP0 of 1min. The indicator has 3 plots, each one representing the number of bars of each Bar series multiplied by a different factor so we can view them easily. With the Output Window open you can see the last BIP0 event shows CurrentBar counters of 4805, 22764, and 33738 for BIP0, BIP1, and BIP2 respectively. The next event was the BIP1 event which updated the BIP1 counter to 22766 and the final BIP2 event updated the BIP2 counter to 33741. There has been no subsequent BIP0 event yet so if it were the case that plots only updated on BIP0 then we would actually still be seeing the original values of 4805, 22764, and 33738, but instead we are seeing the BIP1 and BIP2 updated values on the chart of 4805, 22766, and 33738.

In our test the chart is “refreshing” and updating whenever deemed necessary by the code as it asks to update the plot values. I would be curious how your environment might differ from ours and/or how your code might be different? It would be great if you could breakdown how exactly you came to the conclusion that these values do not update on the chart outside of BIP0.

Thank you.

I have now slightly modified the indicator to show a problem that I have encountered. Same indicator, but I now use a 2 minute chart of 6E and add the 7-min and 29-min bar series of the same instrument 6E. Further I check for historical data to identify whether the ticks shown on the output window are historical or real-time ticks. Then I use the indicator in CalculateOnBarClose = false mode. Indicator is attached.

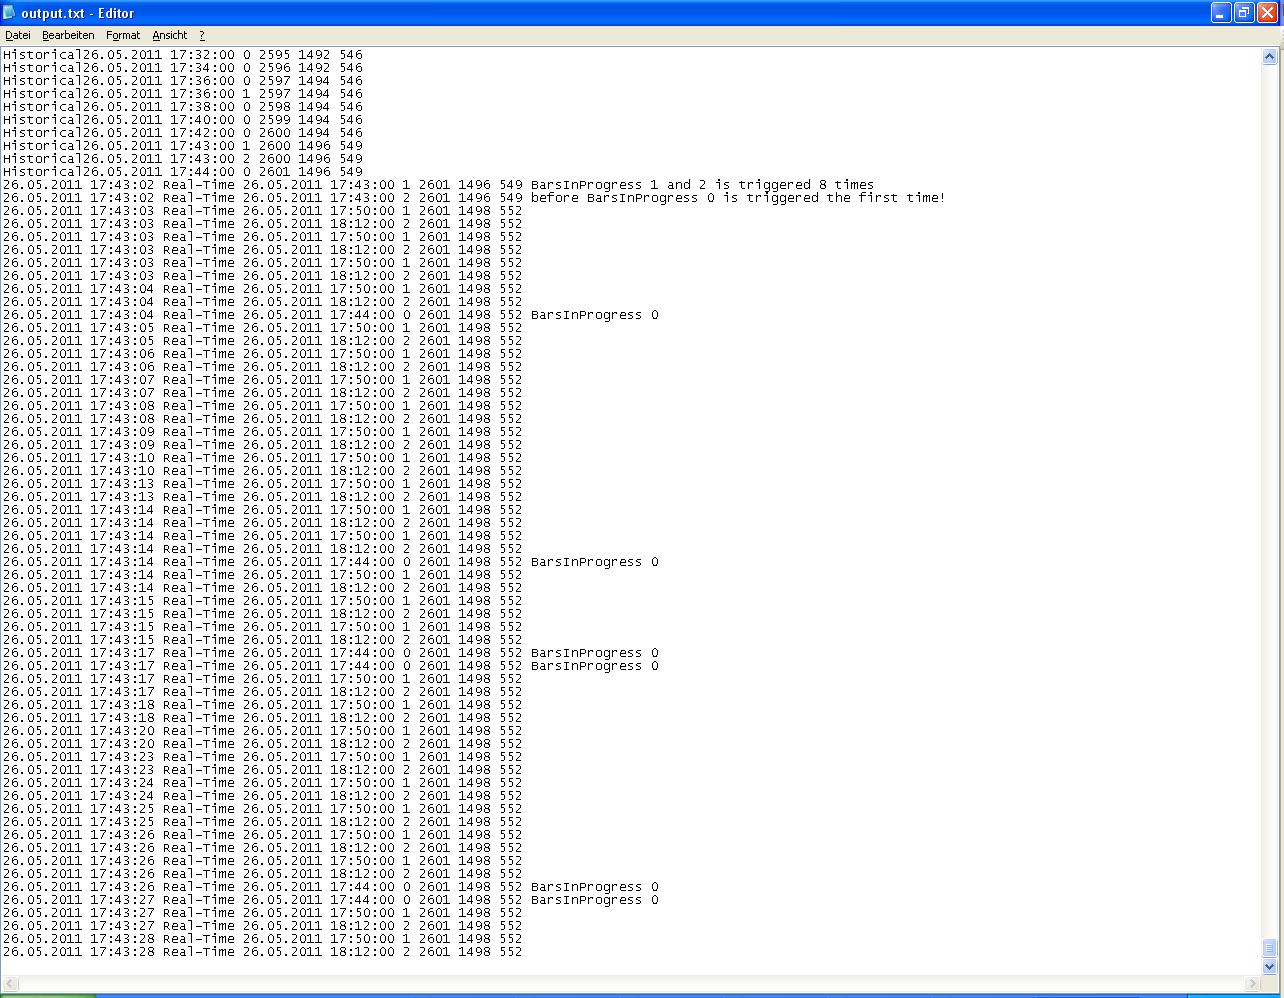
Below is an excerpt from the output file. In real-time, I would have expected that an incoming tick of 6E triggers BarsInProgress 0, 1 and 2 in an alternating way. However, what the output file shows, is that BarsInProgress is not at all called in a logical, but in a fuzzy way.


Attached Files
Elite Membership required to download: output.zip
Elite Membership required to download: BIPTest.zip
Started this thread Reply With Quote
  #34 (permalink)
 
Zondor's Avatar
 Zondor 
Portland Oregon, United States
 
Experience: Beginner
Platform: NinjatraderŽ
Broker: CQG, Kinetick
Trading: Gameplay KlownbineŽ Trading of Globex
Posts: 1,333 since Jul 2009
Thanks Given: 1,246
Thanks Received: 2,731

I ran the BIP test and agree with FT that something looks fishy.

Since all the bars are for the same instrument, all three of the Bar Series should update everytime there is a trade in the instrument. Or so it would seem.

Follow me on Twitter Visit my NexusFi Trade Journal Reply With Quote
  #35 (permalink)
 
Fat Tails's Avatar
 Fat Tails 
Berlin, Europe
Market Wizard
 
Experience: Advanced
Platform: NinjaTrader, MultiCharts
Broker: Interactive Brokers
Trading: Keyboard
Posts: 9,888 since Mar 2010
Thanks Given: 4,242
Thanks Received: 27,103


Zondor View Post
The VisualEMAX with a period of 1 can be used as a proxy for the price of a series with any time frame including or other than that of the chart. But when I try to take advantage of this by runnng an indicator that calls the VisualEMAX3 I get the error:

Error on calling OnStartUp method for indicator VisualEMAX3, Object reference not set to instance of an object.

My indicator then displays nothing.

The same thing happens when I try to apply another indicator to the VisualEMAX3 using the NT7 indicator-of-an -indicator feature of the indicators dialog box.


Because the code is in a DLL I can't do anything about the error. FT, could you please consider adding try{ }catch error handlers to all of the methods of the indicator to make sure that all exceptions are handled to prevent crashing of indicator from unhandled exceptions. Thanks.

@Zondor: Thanks again for identifying the bug. I have tested the indicator and identified the source of the problem. It is the code snippet below, which I used in OnStartUp().

 
Code
if(ChartControl.EquidistantBars)
	equidistantBars = true;
else
	equidistantBars = false;
It seems that ChartControl.EquidistantBars does not return a proper value.

I had used this because the algorithm, which interpolates the values calculated from the secondary bars series works in a different way on equidistant bars and non-equidistant bars as used for multi time series charts.

In case that the VisualEMA is called by another indicator or used in an indicator-on-indicator approach the visual interpolation cannot be used, so the indicator

-> should not be used in visual mode (repainting the distance between current and previous value of secondary bar series
-> does not need the information whether the chart is equidistant or non-equidistant

Does anybody know, how I can check whether the indicator is used for another indicator or whether it plots to a chart?

Started this thread Reply With Quote
Thanked by:
  #36 (permalink)
 
Zondor's Avatar
 Zondor 
Portland Oregon, United States
 
Experience: Beginner
Platform: NinjatraderŽ
Broker: CQG, Kinetick
Trading: Gameplay KlownbineŽ Trading of Globex
Posts: 1,333 since Jul 2009
Thanks Given: 1,246
Thanks Received: 2,731


Quoting 
Does anybody know, how I can check whether the indicator is used for another indicator or whether it plots to a chart?

I don't know how to do this either, but as an expedient you could add a Parameter that allows the user to specify whether the indicator is being used by another indicator, or being displayed on a chart (default).

Needs to be under Category "Parameters" so it will be accessible in the dialog box when setting up the indicator of an indicator.

I asked Ninatrader Support to look into the BIP test. They have been extremely gracious, responsive and helpful.

Follow me on Twitter Visit my NexusFi Trade Journal Reply With Quote
Thanked by:
  #37 (permalink)
 
Fat Tails's Avatar
 Fat Tails 
Berlin, Europe
Market Wizard
 
Experience: Advanced
Platform: NinjaTrader, MultiCharts
Broker: Interactive Brokers
Trading: Keyboard
Posts: 9,888 since Mar 2010
Thanks Given: 4,242
Thanks Received: 27,103


Zondor View Post
I don't know how to do this either, but as an expedient you could add a Parameter that allows the user to specify whether the indicator is being used by another indicator, or being displayed on a chart (default).

Needs to be under Category "Parameters" so it will be accessible in the dialog box when setting up the indicator of an indicator.

I asked Ninatrader Support to look into the BIP test. They have been extremely gracious, responsive and helpful.

I have overwhelmingly positive experience with the support staff as well. Basically there are just a fwe pending issues that are difficult to reproduce.

I do not want to go the route with the user selectable option, whether the indicator will be used within a strategy or by another indicator. As you suggested, I used try{} catch{}, so in case that ChartControl cannot be accessed the indicator will automatically switch to strategy mode. As the information, whether the indicator runs on equidistant bars or not is only needed for the interpolation in visual mode of the indicator, this should be a first solution. This is what I used and it seems to work.

 
Code
try
{
      if (ChartControl.EquidistantBars)
          equidistantBars = true;
      else
          equidistantBars = false;
}
catch
{
      thisCalcMode = VisualEMAX4CalcMode.StrategyMode;
}
Not elegant, but prevents that the indicator stops working.

Started this thread Reply With Quote
Thanked by:
  #38 (permalink)
 
Zondor's Avatar
 Zondor 
Portland Oregon, United States
 
Experience: Beginner
Platform: NinjatraderŽ
Broker: CQG, Kinetick
Trading: Gameplay KlownbineŽ Trading of Globex
Posts: 1,333 since Jul 2009
Thanks Given: 1,246
Thanks Received: 2,731

Again tried using the VisualEMAX as the base for another indicator, this time choosing strategy mode, but got the same error from OnStartUp. I do realize that there is no error handler in this version, but this shows that simply switching to Strategy mode will, by itself, not prevent the error.

Eagerly awaiting the next version....

Thanks.

Follow me on Twitter Visit my NexusFi Trade Journal Reply With Quote
Thanked by:
  #39 (permalink)
 
Fat Tails's Avatar
 Fat Tails 
Berlin, Europe
Market Wizard
 
Experience: Advanced
Platform: NinjaTrader, MultiCharts
Broker: Interactive Brokers
Trading: Keyboard
Posts: 9,888 since Mar 2010
Thanks Given: 4,242
Thanks Received: 27,103


Zondor View Post
Again tried using the VisualEMAX as the base for another indicator, this time choosing strategy mode, but got the same error from OnStartUp. I do realize that there is no error handler in this version, but this shows that simply switching to Strategy mode will, by itself, not prevent the error.

Eagerly awaiting the next version....

Thanks.

Switching to strategy mode alone will not help, as the error was caused by calling 'ChartControl.EquidistantBars'.

The version attached uses the code snippet as per post # 37.

Let me know, whether it works.

Attached Files
Elite Membership required to download: VisualEMAX4.zip
Started this thread Reply With Quote
Thanked by:
  #40 (permalink)
 
Zondor's Avatar
 Zondor 
Portland Oregon, United States
 
Experience: Beginner
Platform: NinjatraderŽ
Broker: CQG, Kinetick
Trading: Gameplay KlownbineŽ Trading of Globex
Posts: 1,333 since Jul 2009
Thanks Given: 1,246
Thanks Received: 2,731


Tested on an 80 tick chart of YM going back 2 days. Plotted the 10 period JMA and the 10 period RSX of the 2 period 2 minute VisualEMAX4

No errors appeared in the output window. Worked fine for the PREVIOUS day, but for the CURRENT (latest) day, got a flat line for both indicators.

This is a big improvement. Looks very promising. Thanks again.

Follow me on Twitter Visit my NexusFi Trade Journal Reply With Quote
Thanked by:


Last Updated on April 19, 2022


© 2024 NexusFi™, s.a., All Rights Reserved.
Av Ricardo J. Alfaro, Century Tower, Panama City, Panama, Ph: +507 833-9432 (Panama and Intl), +1 888-312-3001 (USA and Canada)
All information is for educational use only and is not investment advice. There is a substantial risk of loss in trading commodity futures, stocks, options and foreign exchange products. Past performance is not indicative of future results.
About Us - Contact Us - Site Rules, Acceptable Use, and Terms and Conditions - Privacy Policy - Downloads - Top
no new posts